Imagine a company with sky-high employee turnover. New hires constantly cycle through the door, barely getting up to speed before they leave. This revolving door disrupts workflows, impacts productivity, and eats away profits. Wouldn’t it be helpful to identify these warning signs early on?
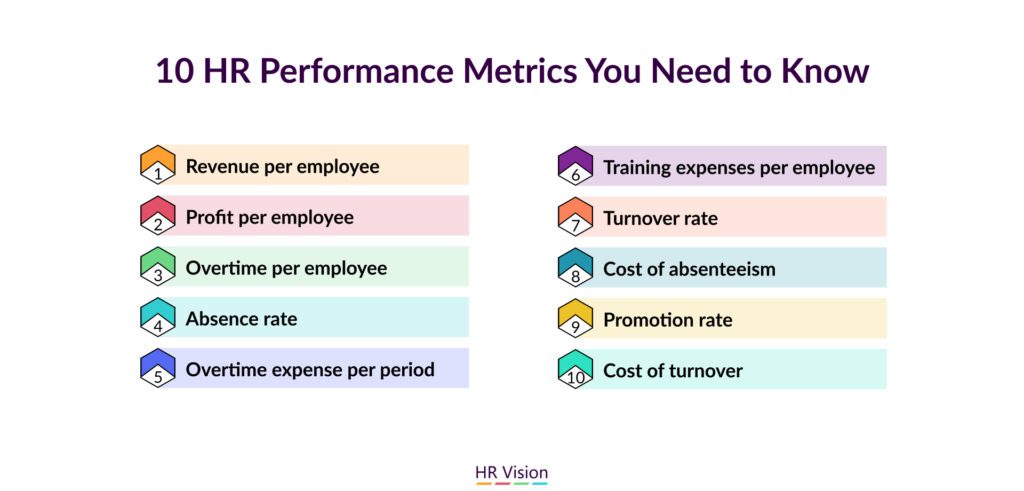
That’s where HR performance metrics come in. These are quantifiable measures that track various aspects of your workforce, like employee engagement, productivity, and retention. By monitoring these metrics, HR professionals gain valuable insights that can inform strategic decision-making across the entire organization. A study by Bersin by Deloitte revealed that companies that leverage HR analytics outperform their peers in several key areas, including revenue growth and profitability. This article will delve into the 10 key HR performance metrics you need to know to build a thriving, engaged workforce.
1. Revenue per employee
Revenue per Employee is a financial metric that measures the average amount of revenue generated by each employee within a specific period. It provides a snapshot of how effectively the workforce contributes to the company’s top line (revenue).
Formula: RPE = Total Revenue / Number of Employees
Example: Let’s say a company has a total revenue of $10 million for a quarter and employs 100 people. Their RPE would be:
RPE = $10,000,000 / 100 employees = $100,000 per employee
This indicates that, on average, each employee generates $100,000 in revenue for the company per quarter. It’s important to note that RPE is a high-level metric and doesn’t account for individual contributions or roles within the company. However, it’s valuable for tracking overall workforce productivity and comparing performance over time or against industry benchmarks.
2. Profit per Employee (PPE)
Profit per Employee (PPE) is a financial metric that takes revenue per employee a step further. It measures the average amount of profit generated by each employee within a specific period. This provides a more nuanced picture of the workforce’s contribution by factoring in expenses and reflecting true profitability per employee.
Formula: PPE = Net Income / Number of Employees
Example: Building on the previous example, imagine the company has a net income of $3 million for the quarter. Their PPE would be:
PPE = $3,000,000 / 100 employees = $30,000 per employee
This indicates that, on average, each employee contributes $30,000 in profit to the company per quarter. Compared to RPE, PPE offers a clearer picture of the workforce’s impact on the bottom line. Remember, net income is calculated by subtracting total expenses from total revenue. Therefore, PPE reflects not just revenue generation but also cost-effectiveness and overall efficiency.
3. Overtime per Employee (OTE)
Overtime per Employee (OTE) is a metric that measures the average number of overtime hours worked by each employee within a specific period. It serves as an indicator of workload, staffing levels, and potential inefficiencies.
Formula: OTE = Total Overtime Hours / Number of Employees
Example: Let’s say a company has a total of 1,000 overtime hours worked in a month by its 50 employees. Their OTE would be:
OTE = 1,000 hours / 50 employees = 20 hours per employee
This indicates that, on average, each employee worked 20 hours of overtime during that month. High OTE can suggest several possibilities:
- Understaffing: The company might not have enough employees to handle the workload within regular working hours.
- Inefficient processes: Tasks might be taking longer than necessary due to poor workflows or inadequate training.
- High workload: There could be a temporary surge in work demands requiring extra hours.
- Important Note: It’s crucial to analyze OTE alongside other metrics like absence rate and project deadlines to gain a more comprehensive understanding of the reasons behind overtime.
4. Absence Rate (AR)
Absence Rate (AR) is a human resource metric that measures the percentage of scheduled workdays employees miss within a specific period. It reflects employee well-being, motivation, and potential scheduling issues.
Formula: AR = (Total Employee Absences / Total Scheduled Workdays) x 100%
Example: Imagine a company with 100 employees and a total of 500 absences during a month with 20 working days (excluding weekends and holidays). Their absence rate would be:
AR = (500 absences / (100 employees x 20 working days)) x 100% = 2.5%
This indicates that, on average, employees missed 2.5% of their scheduled workdays during that month. A low absence rate is generally desirable, suggesting a healthy and engaged workforce. However, it’s important to consider industry benchmarks and potential reasons behind absences (sick leave, vacation, etc.) for a more nuanced interpretation.
Additional Points:
High absence rates can lead to decreased productivity, increased workload on present employees, and higher costs associated with covering absences. HR can analyze absence data by department, reason for absence, and employee demographics to identify potential issues and implement targeted solutions.
5. Overtime Expense per Period (OEP)
Overtime Expense per Period (OEP) is a financial metric that measures the total cost associated with overtime work incurred by the company within a specific period. It helps track how overtime hours translate into actual financial impact.
Formula: OEP = Total Overtime Hours x Overtime Pay Rate x Number of Employees
Example: Let’s say a company has a total of 1,000 overtime hours worked in a month by its 50 employees. Their overtime pay rate is $20 per hour. Their OEP would be:
OEP = 1,000 hours x $20/hour x 50 employees = $1,000,000
This indicates that the company spent $1,000,000 on overtime costs during that month.
- High OEP can have a significant impact on the company’s budget. Analyzing OEP alongside Overtime per Employee (OTE) helps understand the reasons behind the cost.
- High OTE + High OEP: Suggests potential understaffing or inefficient processes leading to high overtime hours and significant financial burden.
- Moderate OTE + Moderate OEP: Might indicate occasional surges in workload requiring manageable overtime expenses.
OEP goes beyond simply tracking overtime hours. It provides valuable insight into the financial implications of overtime and helps assess its cost-effectiveness.
6. Training Expenses per Employee (TEPE)
Training Expenses per Employee (TEPE) is a financial metric that measures the average amount a company invests in employee training and development per employee within a specific period. It reflects the company’s commitment to workforce growth and skill development.
Formula: TEPE = Total Training Costs / Number of Employees
Example: Imagine a company spends a total of $500,000 on training programs for its 100 employees during a year. Their TEPE would be:
TEPE = $500,000 / 100 employees = $5,000 per employee
This indicates that, on average, the company invests $5,000 per employee in training and development annually. A higher TEPE can suggest a strong focus on employee growth and skill development, potentially leading to increased productivity and innovation. However, it’s important to consider:
- Type of Training: Expensive, specialized training will naturally lead to a higher TEPE.
- Training Effectiveness: Analyze if the training translates into improved employee performance and desired outcomes.
7. Turnover rate
Turnover Rate (TR) is a human resource metric that measures the percentage of employees who leave a company within a specific period, usually a year. It reflects employee retention and can have significant consequences for a company’s overall performance.
Formula: TR = (Number of Employees Separated / Average Number of Employees) x 100%
Example: Let’s say a company starts a year with 100 employees and ends the year with 110 employees. During that year, 20 employees leave the company.
- First, calculate the average number of employees: (100 employees + 110 employees) / 2 = 105 employees
- Then, apply the formula for turnover rate: TR = (20 employees separated / 105 average employees) x 100% = 19.05%
This indicates that approximately 19% of the company’s workforce turned over during that year. A high turnover rate can be detrimental, leading to:
- Loss of knowledge and experience: Departing employees take their skills and institutional knowledge with them.
- Recruitment and onboarding costs: Replacing employees incurs significant expenses.
- Decreased productivity: New hires take time to become fully productive.
- Low morale: High turnover can create a sense of instability and impact remaining employees’ morale.
8. Cost of Absenteeism (CoA)
The Cost of Absenteeism (CoA) is a financial metric that measures the total cost a company incurs due to employee absences within a specific period. It goes beyond simply lost wages and accounts for various factors that impact the company’s bottom line.
While there’s no single formula to calculate CoA, it typically considers:
- Wages paid to absent employees: Even for paid leave, there’s a cost associated with unproductive time.
- Overtime costs: Covering absent employees might require overtime pay for existing staff or hiring temporary replacements, leading to additional expenses.
- Decreased productivity: Absences disrupt workflow and team dynamics, potentially impacting overall output.
- Reduced revenue: In some cases, employee absences can directly translate to lost sales or delayed projects, affecting revenue generation.
- Administrative costs: Managing absenteeism records, handling leave requests, and arranging replacements can involve administrative burdens.
Estimating the Cost of Absenteeism:
There are various methods to estimate CoA, some more comprehensive than others. Here’s a simplified approach:
- Average Daily Cost per Employee (ADCE): Calculate the average cost to employ a single worker per day. This includes salary, benefits, and overhead costs. (ADCE = Total Employee Costs / Number of Working Days per Year)
- Absence Rate (AR): Refer to the previously explained Absence Rate metric.
- Estimated CoA: Multiply ADCE by AR to get a rough estimate of the cost of absenteeism per year. (Estimated CoA = ADCE x AR x Number of Working Days per Year)
Example: Imagine a company with an ADCE of $200 and an Absence Rate of 5% (assuming 250 working days per year). Their estimated CoA would be:
Estimated CoA = $200/day x 5% x 250 days = $25,000
This is a simplified example. More sophisticated methods factor in additional costs like lost revenue due to specific absences or the cost of onboarding temporary replacements.
9. Promotion Rate (PR)
Promotion Rate (PR) is a human resource metric that measures the percentage of employees who are promoted within a specific period, typically a year. It reflects internal growth opportunities, career development within the company, and potentially employee satisfaction.
Formula: PR = (Number of Employees Promoted / Total Number of Eligible Employees) x 100%
Example: Imagine a company has 200 employees, and 20 of them receive promotions within a year. Their promotion rate would be:
PR = (20 promotions / 200 eligible employees) x 100% = 10%
This indicates that 10% of the company’s eligible employees were promoted during that year.
10. Cost of Turnover (CoT)
The Cost of Turnover (CoT) is a financial metric that measures the total cost a company incurs when an employee leaves and needs to be replaced. It goes beyond simply filling the vacant position and considers various expenses associated with the entire recruitment and onboarding process, as well as lost productivity during the transition period.
Formula: CoT = (Hiring + Onboarding + Development + Unfilled Time) x (Number of Employees x Annual Turnover Rate)
- Hiring: This includes advertising costs, recruiter fees, and time spent interviewing candidates.
- Onboarding: Consider expenses for training new hires, providing equipment, and integrating them into the team.
- Development: Factor in the lost productivity while a new employee ramps up and reaches full potential.
- Unfilled Time: Account for the period between an employee leaving and their replacement becoming fully functional.
By multiplying this total cost by the number of employees and your annual turnover rate, you get a powerful figure – the annual cost of turnover. This metric allows HR to demonstrate the financial impact of employee retention efforts and the importance of investing in keeping your top talent.
Conclusion
Tracking HR performance metrics isn’t just about numbers, it’s about gaining valuable insights into the health and well-being of your workforce. Understanding these metrics empowers HR to make informed decisions. Is overtime spiking due to understaffing or inefficient processes? Is a high absence rate impacting morale and productivity? By identifying areas for improvement, HR can implement targeted strategies to optimize processes, cultivate a thriving work environment, and ultimately contribute to the overall success of the organization.
Remember, HR performance metrics are just the starting point. By analyzing data, collaborating with leadership, and focusing on continuous improvement, HR can transform data insights into action, ensuring your most valuable asset – your people – are empowered to reach their full potential.
Ready to take your HR expertise to the next level and dive deeper into the future of work? Join us at HR Vision!