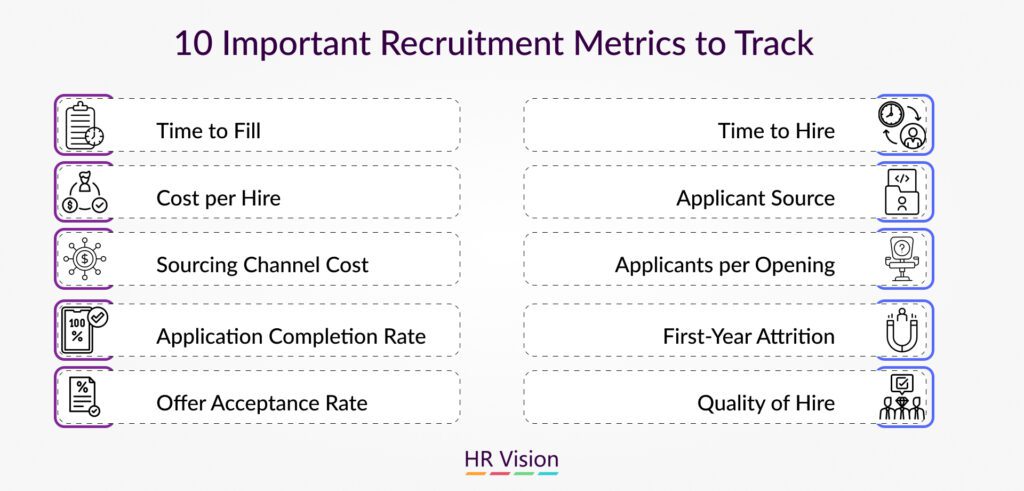
| Time to Fill | Time to Hire |
| Cost per Hire | Applicant Source |
| Sourcing Channel Cost | Applicants per Opening |
| Application Completion Rate | First-Year Attrition |
| Offer Acceptance Rate | Quality of Hire |
Hiring the right people is tough. But with a constant flow of resumes and limited time, making the right hiring decisions can feel like a guessing game. This is where data-driven recruiting steps in. Instead of relying on gut feeling, you track key recruitment metrics to see what’s working and what’s not in your hiring process.
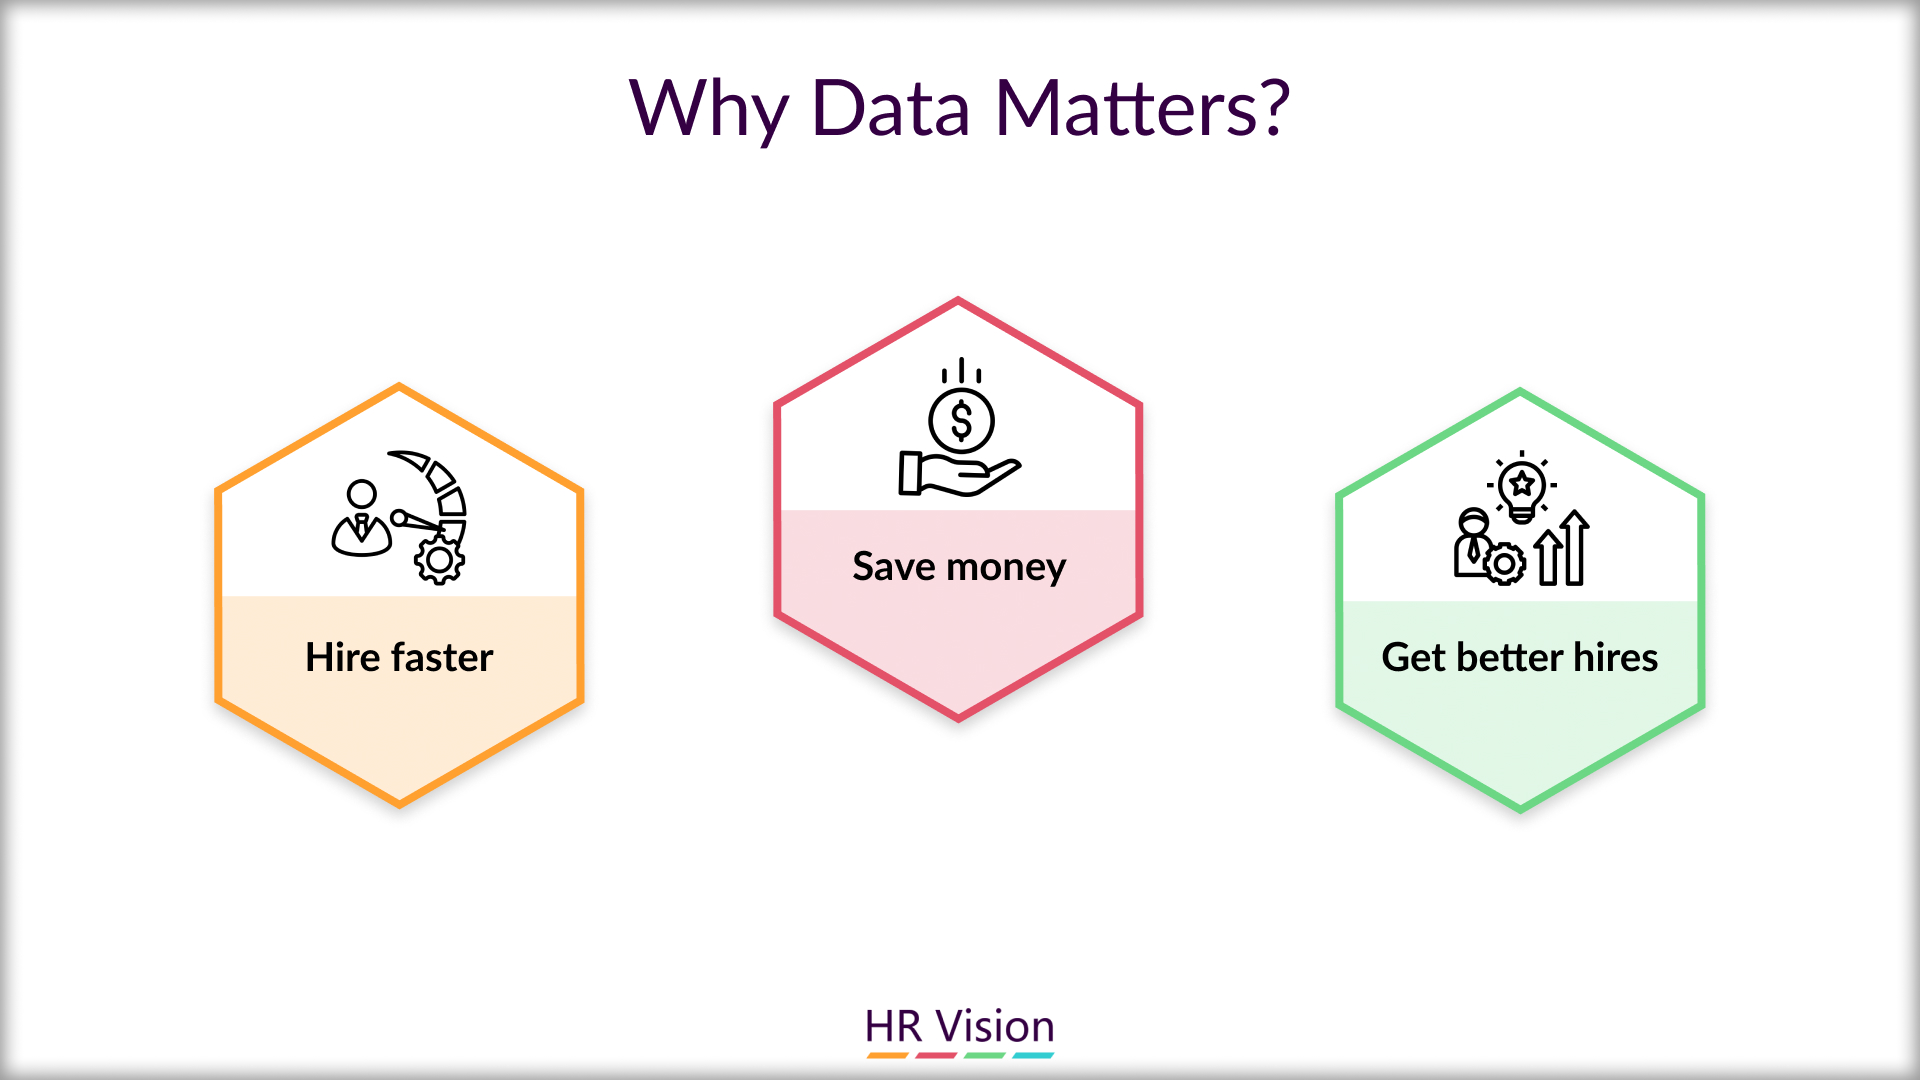
By tracking these recruitment metrics, you can:
- Hire faster: No more waiting forever to fill open positions.
- Save money: Spend less on finding the right talent.
- Get better hires: Find people who will excel in your company.
Data isn’t just about numbers, it’s about making smarter hiring decisions. Let’s dive into the key recruitment metrics to track.
1. Time to Fill
Time to Fill measures the average number of calendar days it takes to fill an open position, from the day a job requisition is approved to the day a new hire accepts the offer.
While there’s no single formula used universally, a common way to calculate Time to Fill is:

Example: Let’s say a job requisition is approved on March 1st and a candidate accepts the offer on April 10th. There are 40 days between those dates. This would be your Time to Fill for that specific position.
Time to Fill is a crucial recruitment metric because it reflects the efficiency of your entire hiring process. A long Time to Fill can have several negative consequences. A lengthy hiring process can leave candidates feeling frustrated and undervalued. Also, the longer a position remains vacant, the more it costs your company in lost productivity and potential revenue.
2. Time to Hire
While both Time to Fill and Time to Hire measure speed in the recruiting process, they look at different timelines:
- Time to Fill: Focuses on the overall hiring process, starting from the day a job requisition is approved to the day a new hire accepts the offer. It captures every step, including internal approvals, advertising, sourcing candidates, interviewing, and making an offer.
- Time to Hire: Concentrates on the candidate’s journey within the hiring process. It starts from the day a candidate applies (or gets sourced) to the day they accept the offer. It focuses on how quickly you identify, assess, and make an offer to the best candidate.

Example: Imagine a candidate applies on March 5th and accepts the offer on April 10th. The Time to Hire for this specific hire would be 36 days.
Time to Hire offers valuable insights into the efficiency of your candidate selection process. A shorter Time to Hire indicates that your interview process is efficient and moves candidates through quickly without sacrificing quality.
3. Cost per Hire
Cost per Hire refers to the total financial investment made to fill a single open position. It takes into account all expenses incurred during the recruitment process.
To calculate your Cost per Hire, simply add up all your recruitment costs and divide it by the number of hires within a specific timeframe (usually a month, quarter, or year):

Example: Let’s say your company spends a total of $20,000 on recruiting efforts in a quarter, including job board postings, advertising, recruiter fees, and background checks. If you hired 5 new employees during that quarter, your Cost per Hire would be $4,000 per person ($20,000 / 5).
Cost per Hire is a critical recruitment metric to track to understand the financial efficiency of your recruitment strategy. By tracking and aiming to reduce your Cost per Hire, you can make informed decisions about where to allocate your recruiting budget. You can explore more cost-effective sourcing methods, negotiate better rates with vendors, and streamline your hiring process to minimize unnecessary expenses.
Finding top talent without breaking the bank is a delicate balance. Here are some strategies to reduce your Cost per Hire without compromising the quality of your hires:
- Leverage Free & Low-Cost Sourcing Channels: Utilize free job boards, professional networking sites like LinkedIn, and employee referral programs.
- Craft Compelling Job Descriptions: Write clear, engaging job descriptions that accurately reflect the role’s requirements and highlight your company culture.
- Prioritize Internal Mobility: Consider promoting from within before searching externally.
- Improve Interview Efficiency: Streamline your interview process by conducting phone screenings for initial qualification checks before progressing to in-person interviews.
4. Applicant Source
Applicant Source tracks the origin of your candidate pool. This could be job boards, social media platforms, employee referrals, career fairs, or any other channel where candidates learn about your open positions.
There’s no specific formula for Applicant Source. It’s a qualitative HR metric tracked by categorizing where candidates come from when they apply. Most Applicant Tracking Systems (ATS) allow you to tag or categorize applicants based on their source.
Example: You might track that 20% of applicants for a Marketing Manager role came from LinkedIn, 30% from a specific job board, and 10% from employee referrals.
Analyzing Applicant Source data lets you see which channels deliver the most qualified candidates. Focus your resources on the channels that generate the best results. If certain channels are underperforming, you can adjust your strategy and allocate your recruitment budget strategically, investing more in channels that consistently deliver qualified hires. For example, if a job board isn’t yielding strong applicants, experiment with a different platform or tailor your job postings to be more targeted.
5. Sourcing Channel Cost
Sourcing Channel Cost tracks the financial investment associated with each channel you use to attract candidates. This includes costs like job board postings, advertising fees, recruiter commissions, and travel expenses for attending career fairs.
Analyzing Sourcing Channel Costs alongside Applicant Source data is crucial for optimizing your recruitment budget. Compare the cost of each channel with the quality and quantity of candidates it attracts. A high-cost channel might be justified if it consistently delivers top talent, while a cheaper channel might need revisiting if it yields few qualified applicants.
You can calculate the cost per hire for each channel by dividing the total cost of that channel by the number of hires it generates within a specific timeframe:

Example: Let’s say a specific job board costs $1,000 per month to post jobs, and it delivers 20 qualified applicants over a three-month period, resulting in one successful hire. The cost per hire for this job board would be $3,000 ($1,000/month x 3 months) divided by 1 hire, equaling $3,000 per hire.
Tracking Sourcing Channel Costs helps you understand the return on investment (ROI) of your recruitment efforts. By knowing which channels are most cost-effective in attracting top talent, you can optimize your budget allocation and maximize your return.
6. Applicants per Opening
Applicants per Opening, also known as Candidate-to-Job Ratio, reveals the average number of candidates who apply for a single open position.
This is a simple ratio calculated by dividing the total number of applicants for a specific role by the number of openings for that role within a defined timeframe (usually per job posting).

Example: If you receive 50 applications for 2 Marketing Specialist positions, your Applicants per Opening would be 25 (50 applicants / 2 openings).
Why it’s Important:
Applicants per Opening is a recruitment metric for understanding the competitiveness of your job openings:
- High Ratio (Many Applicants): A high number of applicants can indicate a well-written job description, a strong employer brand, or the position being highly desirable. However, it can also suggest challenges in efficiently screening a large pool of candidates.
- Low Ratio (Few Applicants): A low ratio could signify an unattractive job posting, a niche skill set requirement, or a poorly targeted sourcing strategy. It might lead to difficulty finding qualified candidates.
You can gain insights into the effectiveness of your recruitment efforts by tracking Applicants per Opening. A healthy applicant pool, with a moderate ratio, is ideal. It suggests you’re attracting qualified candidates without being overwhelmed by unqualified applications.
7. Application Completion Rate
The Application Completion Rate measures the percentage of candidates who start an application for a position and actually complete and submit it.
This rate is calculated by dividing the number of completed applications by the total number of applications started, then multiplying by 100 to express it as a percentage.

Example: Imagine 100 candidates begin an application for a role on your company’s careers page. If only 60 candidates actually finish and submit the application, your Application Completion Rate would be 60%.
A low Application Completion Rate can indicate a problem with your application process. For instance, a lengthy or confusing application with too many steps can discourage candidates from finishing.
8. First-Year Attrition
First-year attrition refers to the percentage of new hires who leave your company within the first year of their employment. It’s a crucial HR metric for measuring the effectiveness of your onboarding process, company culture fit, and overall employee retention strategy.
There’s a common formula to calculate First-year Attrition:

Example: Let’s say your company hired 50 new employees in a year, and 8 of them left within the first year. Your First-year Attrition Rate would be 16% ((8 departures / 50 hires) x 100).
High First-year Attrition can have significant negative consequences. One big issue is the cost of replacing employees who leave. This includes the money spent on finding new hires, training them, and the productivity lost during the transition. Overall, high attrition reflects poorly on your company culture and can make it harder to attract top talent in the future.
9. Offer Acceptance Rate
The Offer Acceptance Rate reflects the percentage of candidates who accept your job offer after going through the interview process. It reveals how attractive your offer (including salary, benefits, and company culture) is to qualified candidates.
This HR metric is calculated by dividing the number of accepted offers by the total number of offers made within a specific timeframe, typically expressed as a percentage.

By tracking your Offer Acceptance Rate, you can identify areas for improvement and make your offers more attractive to top talent.
10. Quality of Hire
One more key HR metric to consider in evaluating the effectiveness of your hiring process is the Quality of Hire. It is a broad recruitment metric to track that goes beyond simply filling an open position. It assesses the long-term value a new employee brings to your company. This can include factors like performance, productivity, cultural fit, retention rate, and positive impact on the team.
There’s no single formula for Quality of Hire. However, you can utilize various methods to evaluate it:
- Performance Reviews: Regularly evaluate new hires’ performance against set goals and objectives.
- Retention Rates: Analyze how long new hires stay with the company. A low turnover rate suggests good quality of hire.
- Employee Engagement Surveys: Gauge new hires’ satisfaction, motivation, and overall fit within the company culture.
- Manager Feedback: Gather feedback from hiring managers on the new hire’s contributions and impact on the team.
By focusing on Quality of Hire, you can ensure you’re building a strong, well-rounded team that drives your business forward. While there’s no single perfect formula, implementing a multi-pronged approach using the methods mentioned above will give you valuable insights into the long-term value your new hires bring to the organization.
Conclusion
Data-driven recruitment offers a powerful lens to optimize your talent acquisition strategy and build a strong, successful team. Data is more than just a record of what’s happening; it empowers action. By tracking these recruitment metrics, you can continuously refine your strategy, attract the best talent, optimize your budget allocation, and ultimately build a winning team that drives your business forward. Analyzing key HR metrics allows organizations to gauge the effectiveness of their recruitment strategies and ensure alignment with company culture and long-term objectives. Remember, data-driven recruitment isn’t about finding just any candidate – it’s about finding the perfect fit for your company culture and long-term goals.
Want to delve deeper into HR Analytics and its impact on talent acquisition? Join us at HR Vision! Learn from the top HR leaders about the latest trends in data-driven recruitment and discover how to leverage HR recruitment metrics to build a winning team.